1. What is a what-if analysis?
What-if analysis is one of the most common practices in FP&A - financial planning and analytics. Used by decision-makers across all industries, it is often mystified and overcomplicated. But in fact, there is nothing too complicated about the concept.
What-if analysis is a risk assessment method in which you change inputs and investigate how the change affects the output.
Pretty simple, right?
2. Why use what-if analyses?
You would probably check out a flight simulation game before piloting your first ACTUAL airplane. To test out how it would look without the actual dangers of crashing. But just like there are differences between a flight simulator and flying a plane in real life, there are differences between making hypotheses and testing them in real life.
That is what what-if analysis in a business context roughly is: you do a thought experiment and try to analyze the results of the business initiative before actually flying up with unsuspecting passengers (other stakeholders in this case). You try to find out WHAT would happen IF…
3. What-if analysis and financial modeling
Before we go any further, let us try and distinguish the two similar, most commonly used concepts in this context: sensitivity analysis and scenarios. Researching this article, we found different sources sometimes use the terms “what-if scenario”; “what-if analysis”; “scenario analysis” and “sensitivity analysis” interchangeably. They are close but not synonyms.
3.1. Sensitivity analysis
This one is pretty simple: sensitivity analysis is changing the one (independent) variable and investigating how this affects the other (dependent) variable in the model for the same period. It is often also called a what-if analysis or simulation analysis.

Example: Sales director wants to tweak the price of a product in their portfolio and see how this would affect the overall revenue numbers.
3.2 Scenarios
Scenarios are a bit more complex to execute but not too hard to explain. In scenario analysis, you change one or more variables and investigate how the changes affect multiple dependent variables in the model.

Example: Sales director wants to find out how switching to new raw materials in production affects the revenues coming in from multiple products in the company’s portfolio.
4. What-if analysis in Excel - definitions
As far as what-if analyses go, Excel has several built-in tools that can be extremely useful if used correctly. These tools give users a way to change the input values without changing the data itself. They are Scenarios, Data tables, Goal seek.
4.1 Scenarios
The scenario tool in Excel is used to store and show several versions of data in the same cells. Up to 32 to be more specific. Planners use base, best, and worst-case scenarios most commonly, though. According to Microsoft, a Scenario is a set of values that Excel saves and can substitute automatically in cells on a worksheet.


4.2. Data tables
The data tables tool is used when you have a formula with one or two variables and want to see all possible outcomes for different combinations of each variable. You can use one or two variables to create a data table what-if analysis.
Example: You plan to put $2000 in a savings account with a 5% compound monthly interest rate, and you want to make a calculator that will help you determine what happens with your savings after some time. The variables you can change are the initial amount you put in the account and the number of years you will save. With Data tables, you can generate a table that tells you your total savings balance if you change the initial amount you will put in your account.

It is possible to create a similar table using the time variable, but also using both time and the initial amount:

4.3. Goal Seek
Goal Seek is used if you know the result you would like to get from a formula, but you want to calculate its inputs. In other words, you backward engineer the formula's inputs.

Example: A demand planner wants to generate $150 000 by selling four products in the portfolio. The Goal Seek tool can help them determine how much Product 4 they need to sell to get to the wanted revenue numbers if they already know the amounts for Products 1, 2, and 3.
The issue with Goal Seek is that it only supports one input and one output cell, so it is somewhat limiting in solving more complex problems.
5. What-if analysis in Excel - How to?
The best way to wrap your head around these tools is to see how planners use them. To do this, we decided to create a somewhat simplified financial model of a hypothetical pharmaceutical production company. Planning problems of some of our clients that produce and distribute their products inspired us.
We will not go into too much detail on how we built the model, and we will try to focus only on the what-if analysis part. You can download the model on the link below, and find more information about it with detailed instructions on using it in the file.
In our hypothetical company, the demand planners want to create a sales strategy for 2022, based on the sales numbers from 2021. The management instructed them to raise the gross margin by 2%. Because of how the company operates, the only variables they can change and manipulate relatively easily are the price of the products and the promo discount.
Using all of the information above, the planners want to investigate:
How will the price increase of 4% for some of the products affect the gross margin?
How will lowering the discount by 3% for some clients affect the gross margin?
How to combine these two variables to get the biggest gross margin numbers?
The crucial part of the model is the sales report, and all what-if analyses are made around it. Here is what it looks like:

You can see the sales numbers for 2021 (the previous year). This report is built using slicers and pivot tables, so the planners can drill down and investigate the numbers for each client, brand, and product category in detail.
But the magic happens in the What-if analysis tab. Demand planners can use Excel’s scenario manager tool to play with different combinations of price increases and discount decreases to get to the desired gross margin increase.

This is the final result of our what-if analysis process. Here is how we got to it:
First, we created a tab where we combined the client, product data, and transactions data and made some calculations to get a detailed 2021 sales report - Model Calculations tab. All crucial calculations for the entire model are done here.

For practical reasons, we used pivot tables and slicers to make a more user-friendly sales report with all the calculations needed to make a what-if analysis. It is easier to navigate the data and drill down into specific clients, products, and product segments.
After making the sales report for 2021, we used it as a base for what-if analysis. We know that two variables that we’re going to change are the price change and promo discounts, so we created a partly interactive what-if analysis tab with the comparison of actual sales from 2021 and the cells where we can manipulate the two independent variables. Here’s how it looked:

To designate the products and clients whose prices we are going to tweak in the what-if analysis, we created two additional tabs for SKUs and clients, respectively. Download the spreadsheet to learn more about these two tabs.
Next, we created a Scenario sales report but with calculated values for the two variables, which we’ll use in the what-if analysis. We copied the sales reports from 2021 and added several calculated columns with what-if prices and discounts:

We know that our scenarios are 4% product price increase, 3% client discount decrease, and the combination of the two. So we go to Data>What-if analysis>Scenario manager to define the scenarios:

Next, we define the price increase scenario. The changing cell is the cell we need to use to define the price increase percentage:

After this, we need to set the value of 4% for our first scenario, like this:

And we do the same for the second scenario:

In the third scenario we change 2 variables simultaneously:

Here is the final result with all 3 scenarios defined:

Now we can select each scenario and show them in the cells.
We can compare the 2021 actuals and 2022 scenarios in the sales report table.
The only thing left to do is to show the scenario results in the Scenario Summary table:


Our hypothetical demand planners can use the what-if dashboard to tweak the variables as they please, depending on the business goals and conditions. The downside of this approach is that the scenario summary reports aren’t interactive and need to be generated manually for every new scenario.
6. Problems with Excel what-if analysis
Although Excel is a powerful tool, there are many disadvantages in using it as only financial planning and what-if analysis tool, compared to dedicated financial planning tools. Excel can be a lot of work - users need to edit too many variables manually to get results. The model we built is a simplified example of what companies use. Even simplified, it is not easy to compare different versions of data using it - we would “drown” in pivot tables trying to make best and worst-case versions of plan values in the model. The work would double if we tried to make changes in one of the versions on the go, as planners often need to do. Every change in the model requires multiple re-calculations and pivot tables and data slicer refreshes.
Our modeler spent three days building the model and scenario analyses. In his own words, it was sometimes “nerve-racking” trying to connect everything and make it presentable and intuitive to use. We did our best to make the reports and tables as interactive as possible, but the technical capabilities of the Excel surroundings made it difficult.
Also, when working with complex models in Excel, you need to be ready to face some illogical situations: in our sales report table, Excel automatically adds all gross margin percentages. We can override that by building additional tables and calculations, adding the absolute values, and transforming them into percentages, but it is simply frustrating.
7. What-if scenarios in Farseer
There is an easier way to do all this. We know because we built the software specifically for this purpose. So let’s see what it takes to do all this in Farseer.
Like with Excel, we will not go into details of Farseer modeling. We’ll just say that the entire financial model of the company, with interactive dashboards, slicers, and what-if analyses, was finished in less than three hours, which is significantly better than the three days it took to set up everything in Excel.
This is because Farseer enables users to automate master data import and mapping. They can model using custom templates and advanced formulas which cannot be deleted. There is also no need to use VLOOKUP and similar functions because Farseer has an advanced database. Most calculations are automated and happen in the background.
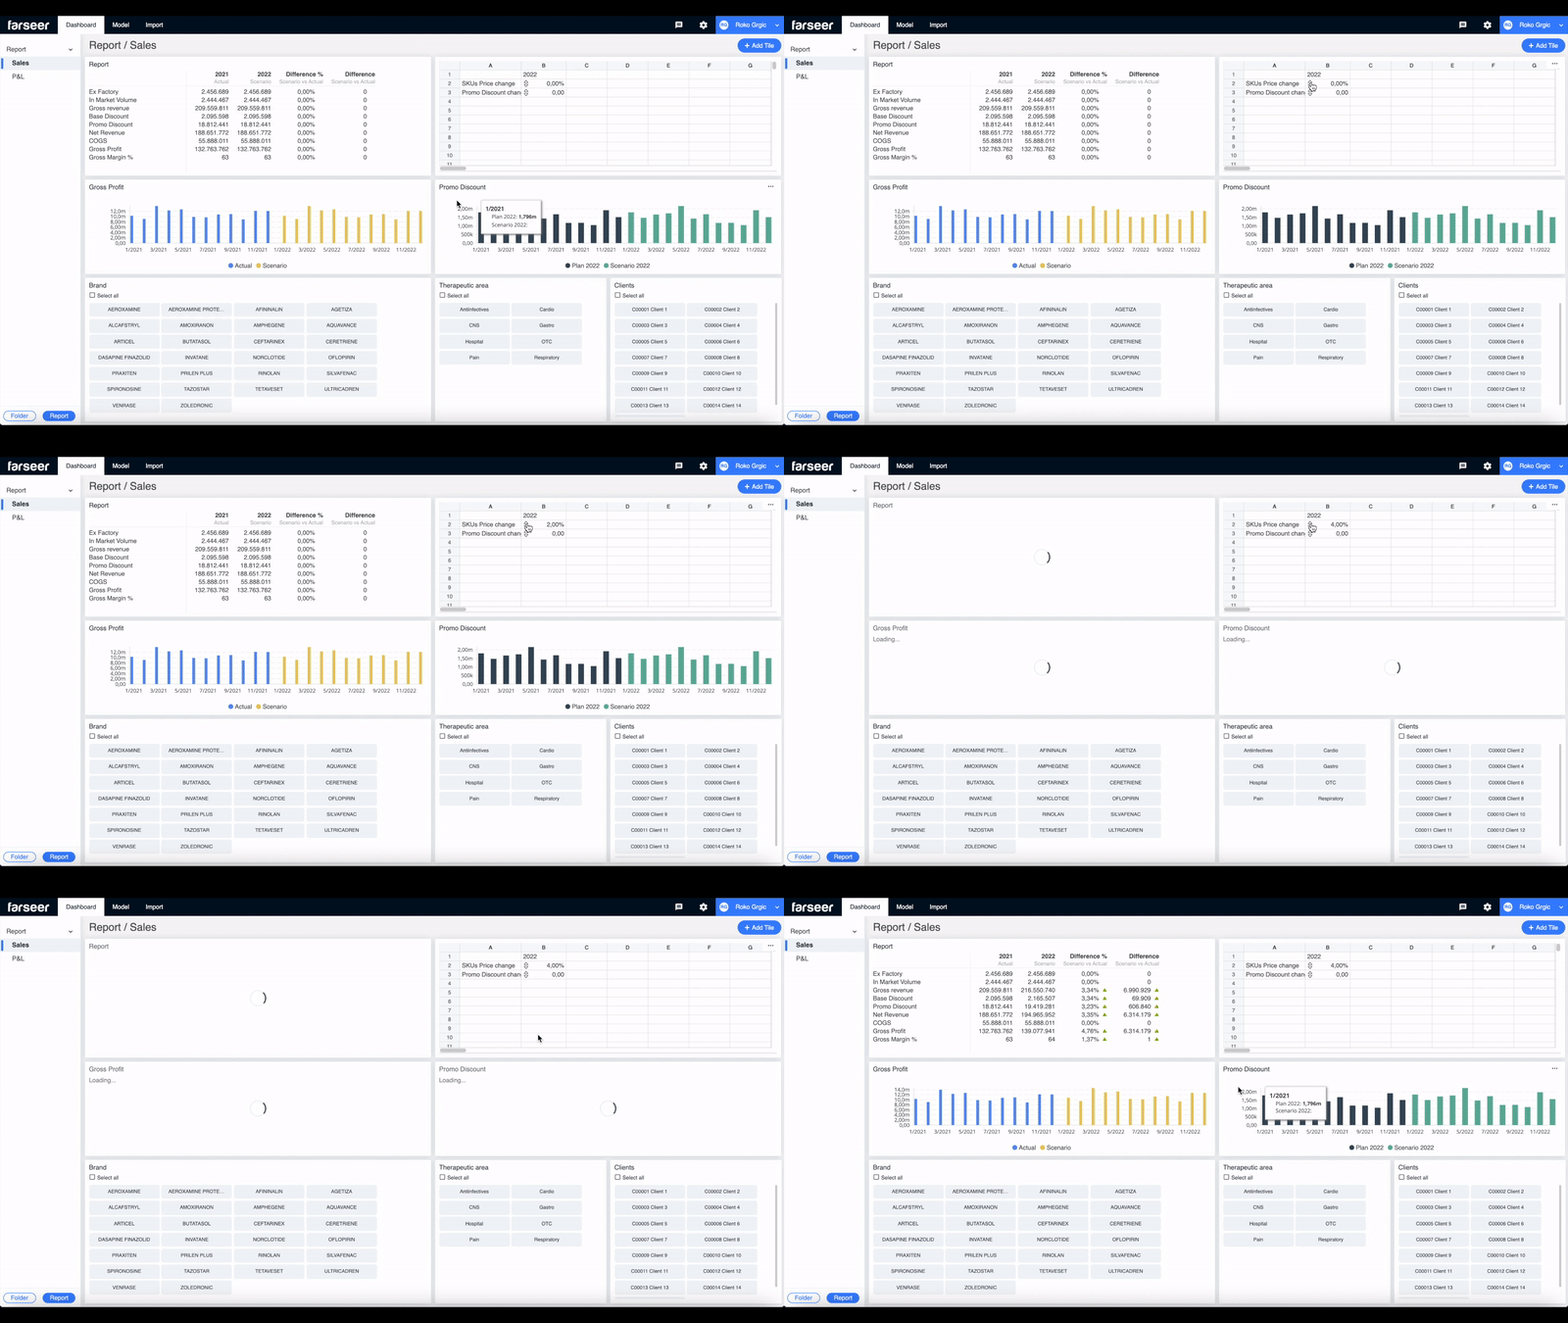
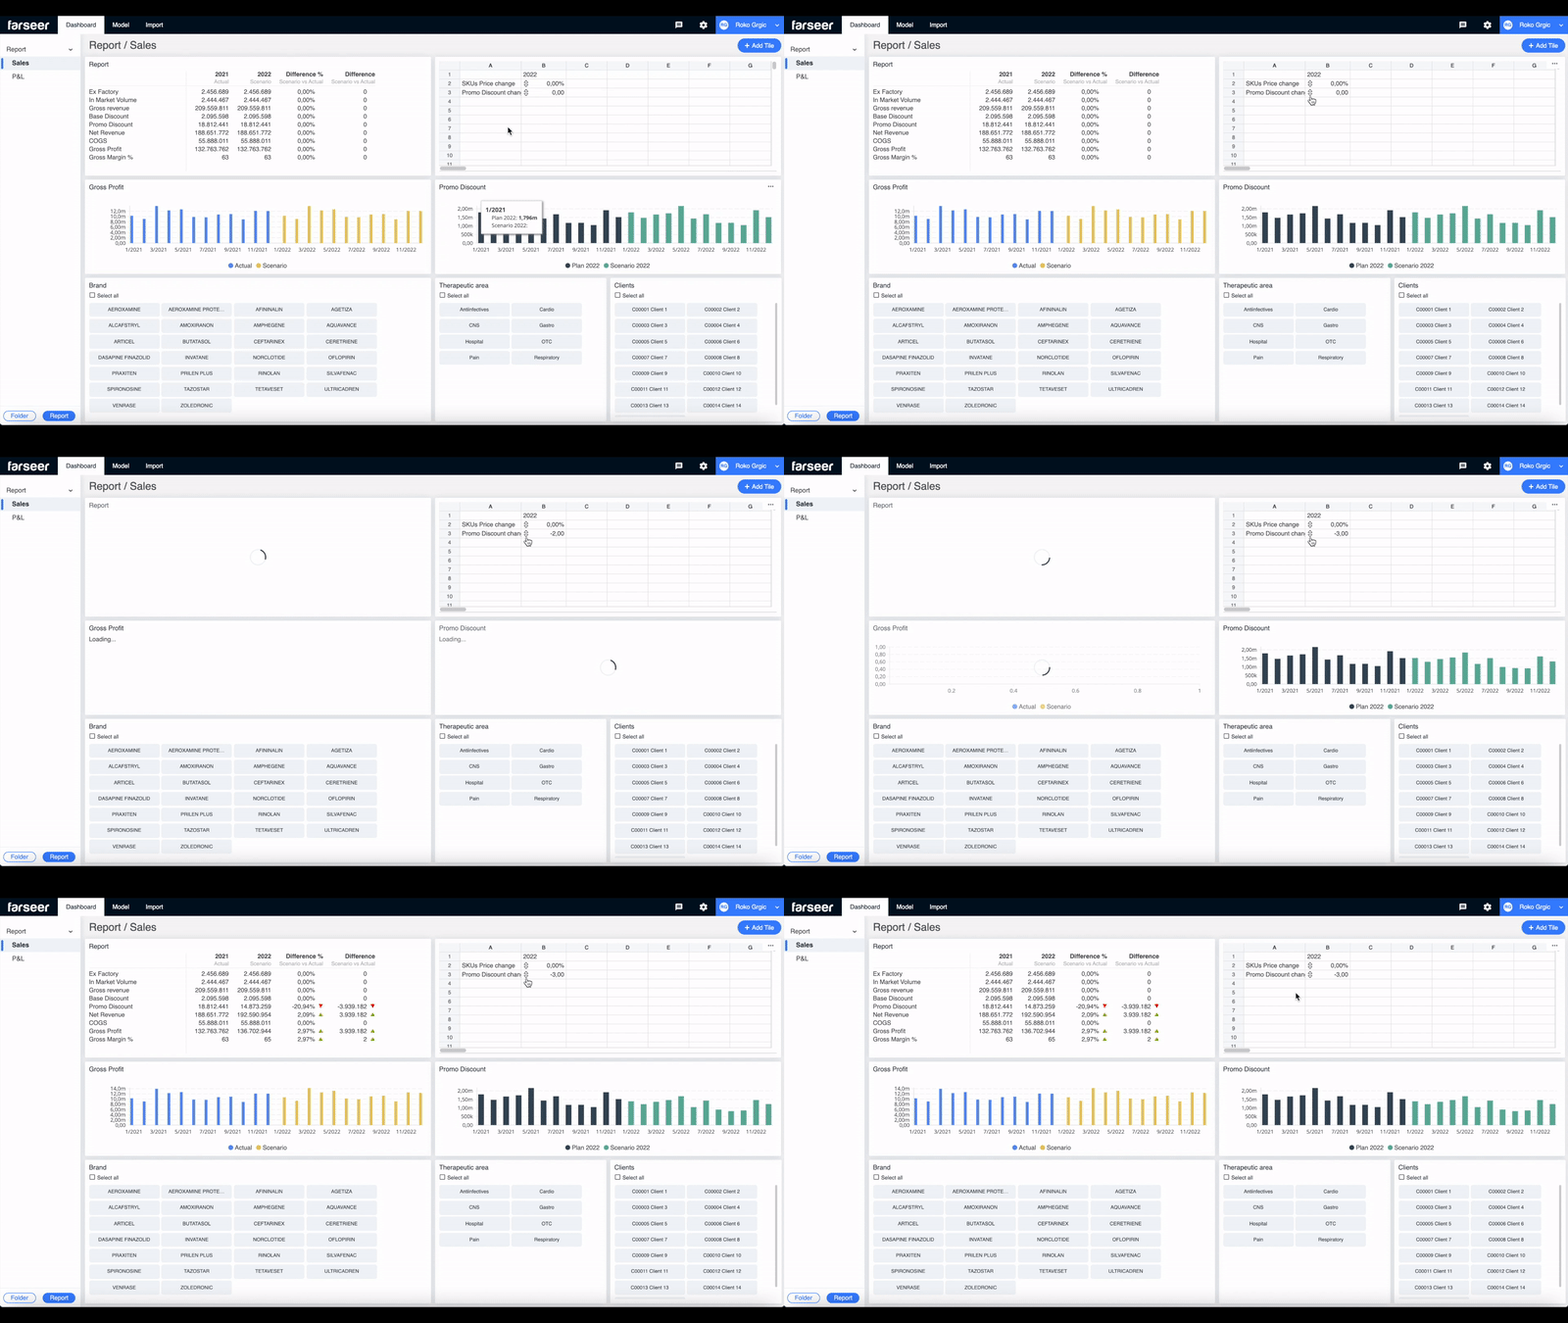
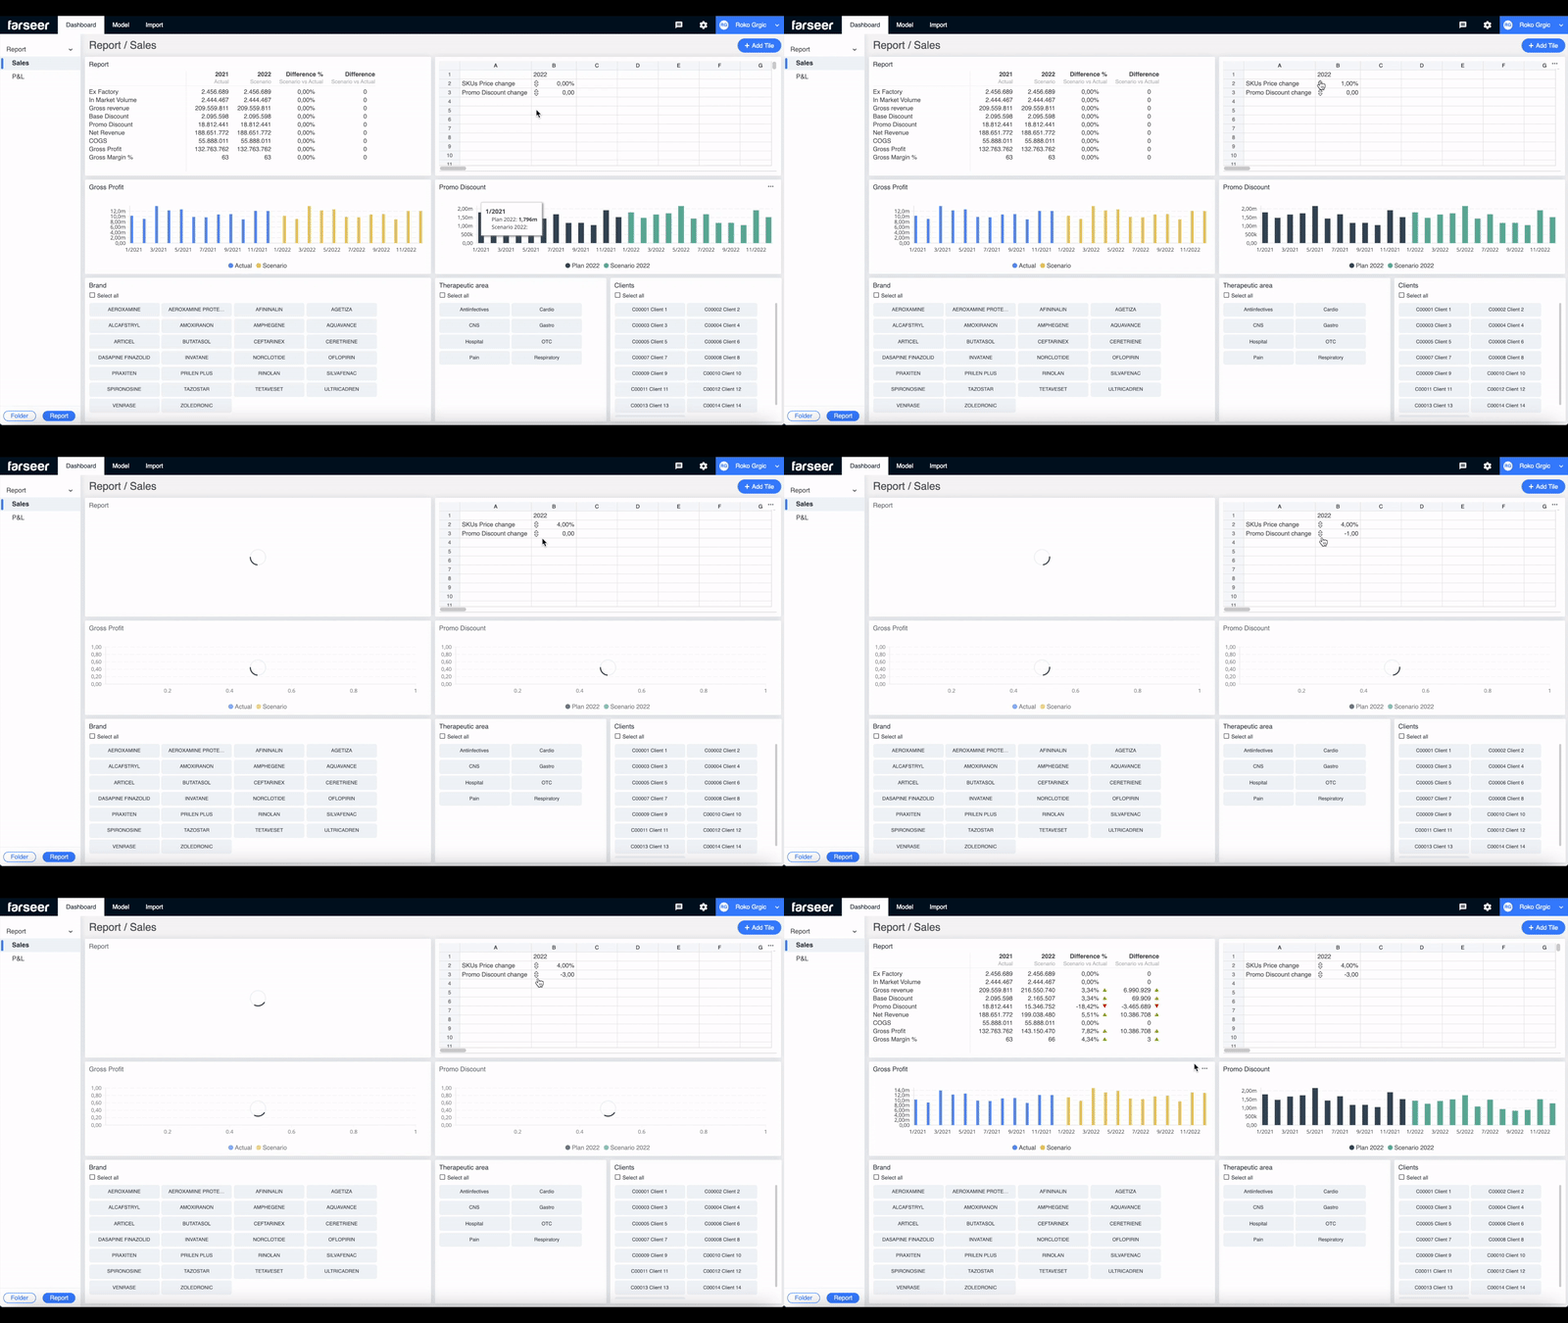
So, what about our what-if scenarios? In Farseer, users do them in the custom Dashboard connected to the Farseer model and the database, so the data is automatically synced. This makes collaboration easy; because all users see the latest version of the data as soon as they log in. We recreated our what-if analyses from the spreadsheet in the Farseer dashboard:

Here is the first scenario, 4% product price increase:

The second scenario, lowering the client promo discount:

The third scenario, combining the 2 variables:

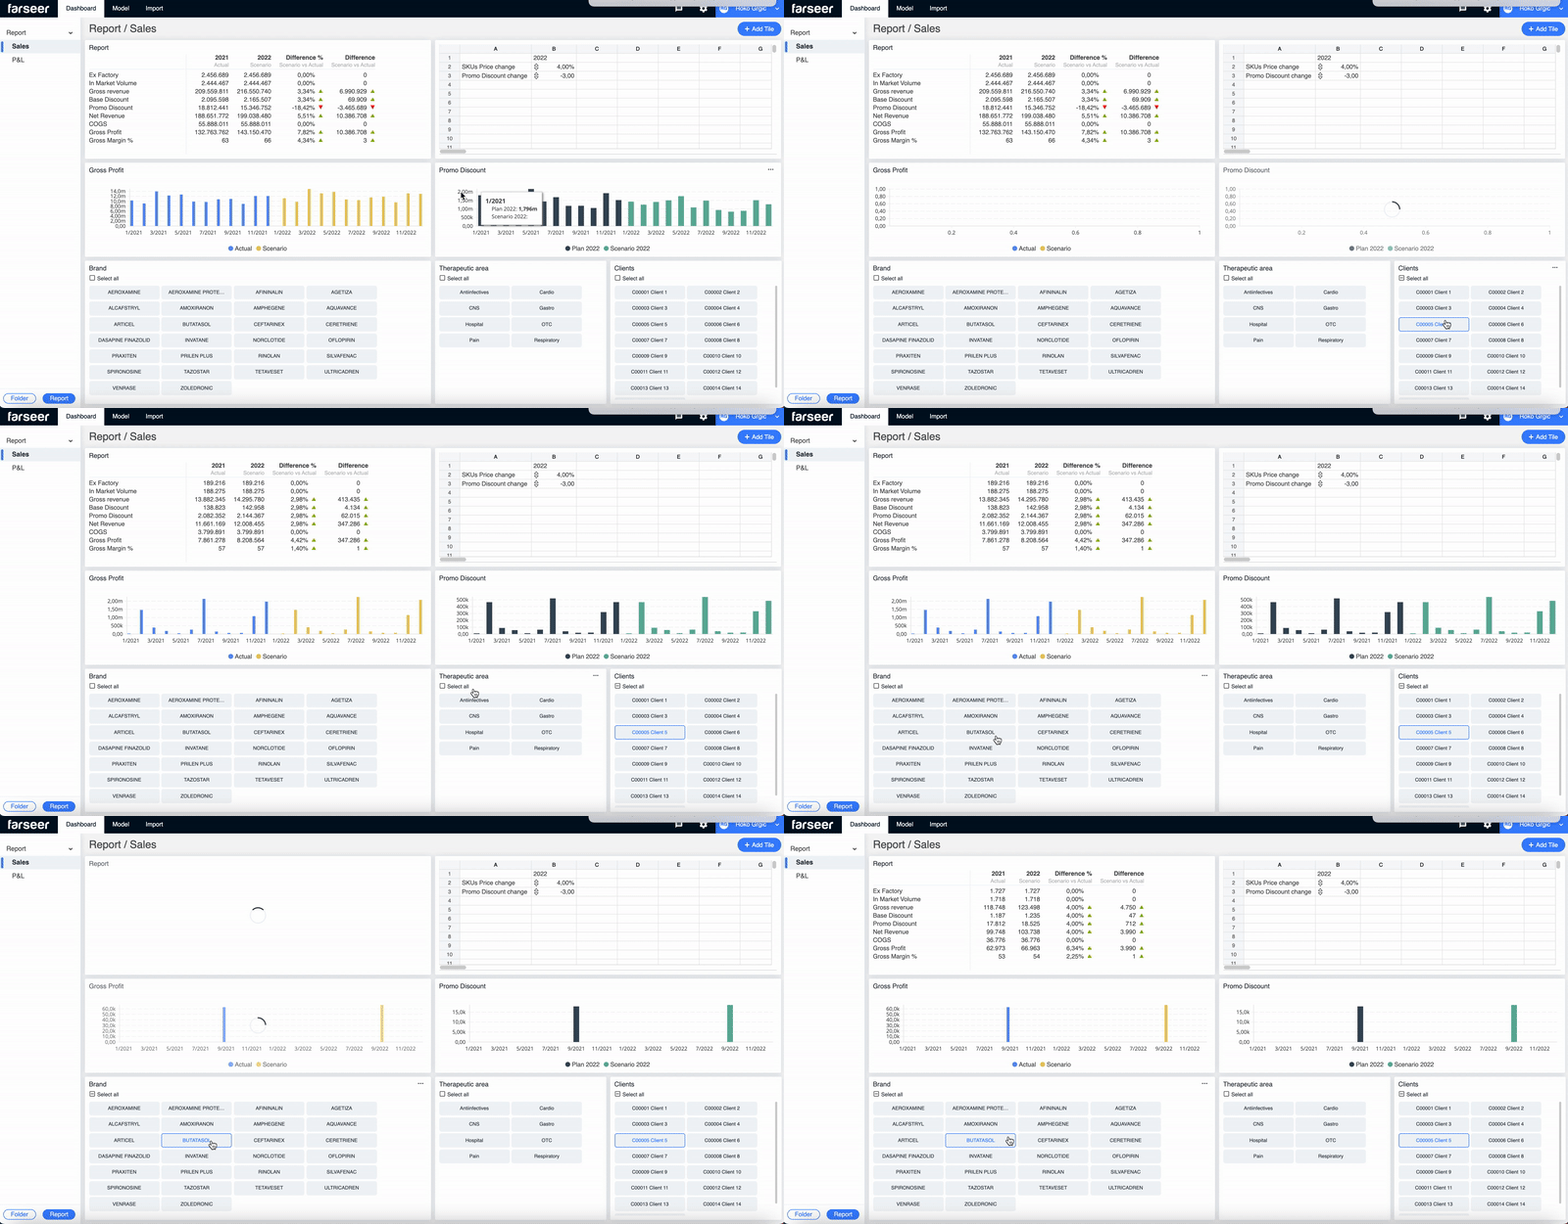
As you can see, as soon as we change the what-if variables, the sales report table and charts automatically refresh. Also, by using slicers, it is easy to drill down to any client and SKU, and see how the scenario affected them:

Every element on the Dashboard is interactive and easily customizable. Users can add new columns to the Sales report table without having to connect them to the model. Unlike in Excel, Farseer charts refresh because they sync with the Farseer database automatically, and the engine does the work quickly in the background.
If you are interested in learning more about Farseer and how it can help automate your financial planning and analytics processes contact us. We will be happy to arrange a live demo and show you how you can liberate your company from messy and clunky spreadsheets and move on to a specialized planning solution.