
Using Excel without Pivot and Tables is like going to the beach when there is no sun: you can do it, but what is the point? People sometimes avoid tables because they are generally used for big data sets, and some people shudder at the thought of big data sets in general and particularly in Excel. That is not a surprise given that sometimes Excel can be slow, there is a higher chance of making an error, and it is hard to analyze and visualize larger amounts of data.
Excel has its limits, like everything else. But that is why knowing Pivot and Tables can help you a lot in your everyday work life. They are built for data processing.
Pivot Tables
If I have to pick one single best feature in Excel, it would definitely be Pivot tables. I worked with them a lot while crunching the numbers in the financial sector, and my clients used them even more in their analysis. So basically, they are widely used, and knowing how to handle them can help you a lot in your everyday work - they are powerful, easy to use, and will save you a lot of time. Creating them is a first step for sure:
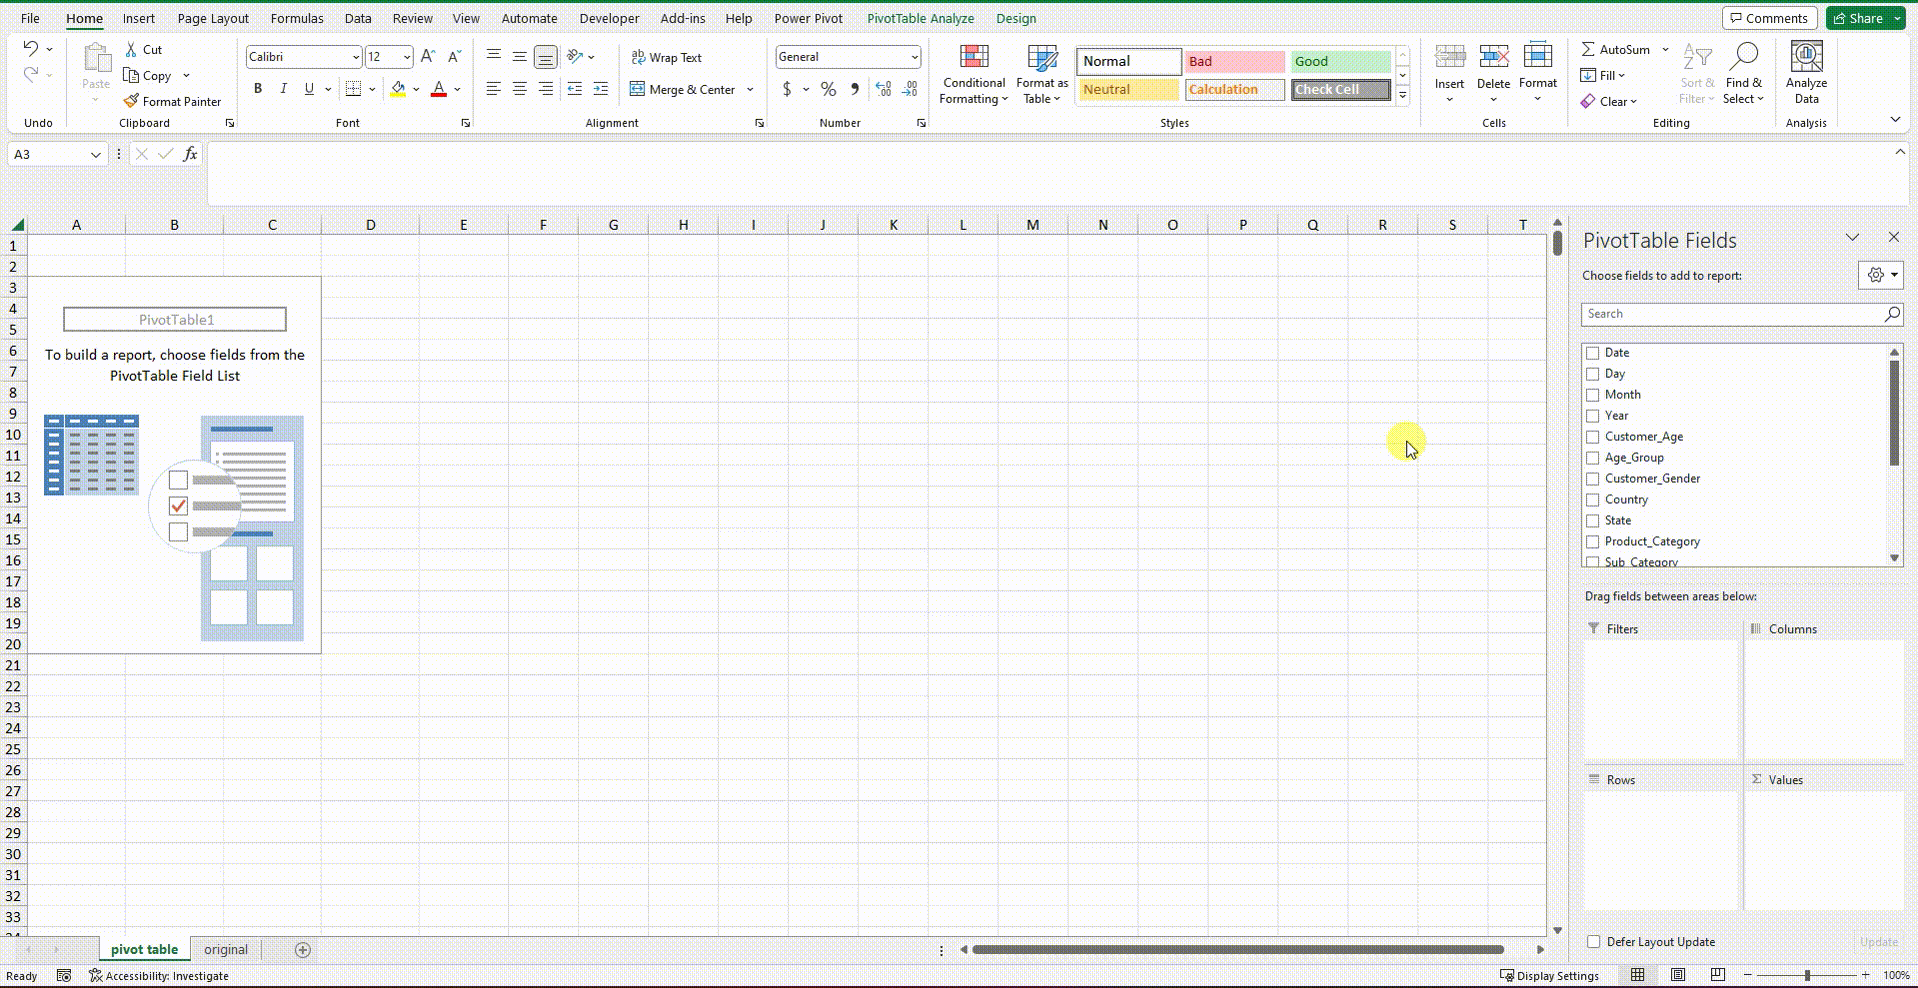
When creating pivots, Excel will automatically add two new pop-ups: PivotTable Analyze and Design, and you can find all the features you need to work with them there.
RECOMMENDED PIVOT
A super helpful feature I overlooked for the first couple of years working in Excel is Recommended PivotTables. You can find it in the Insert tab. Excel will analyze the data and give you some templates to help you make your pivots faster - use them.

DESIGN
Design-wise, you can edit your tables pretty fast, choose tabular, outline, or compact form, show or hide subtotals and fill in the blanks (repeat line items). You can also change colors and add banded rows or columns.

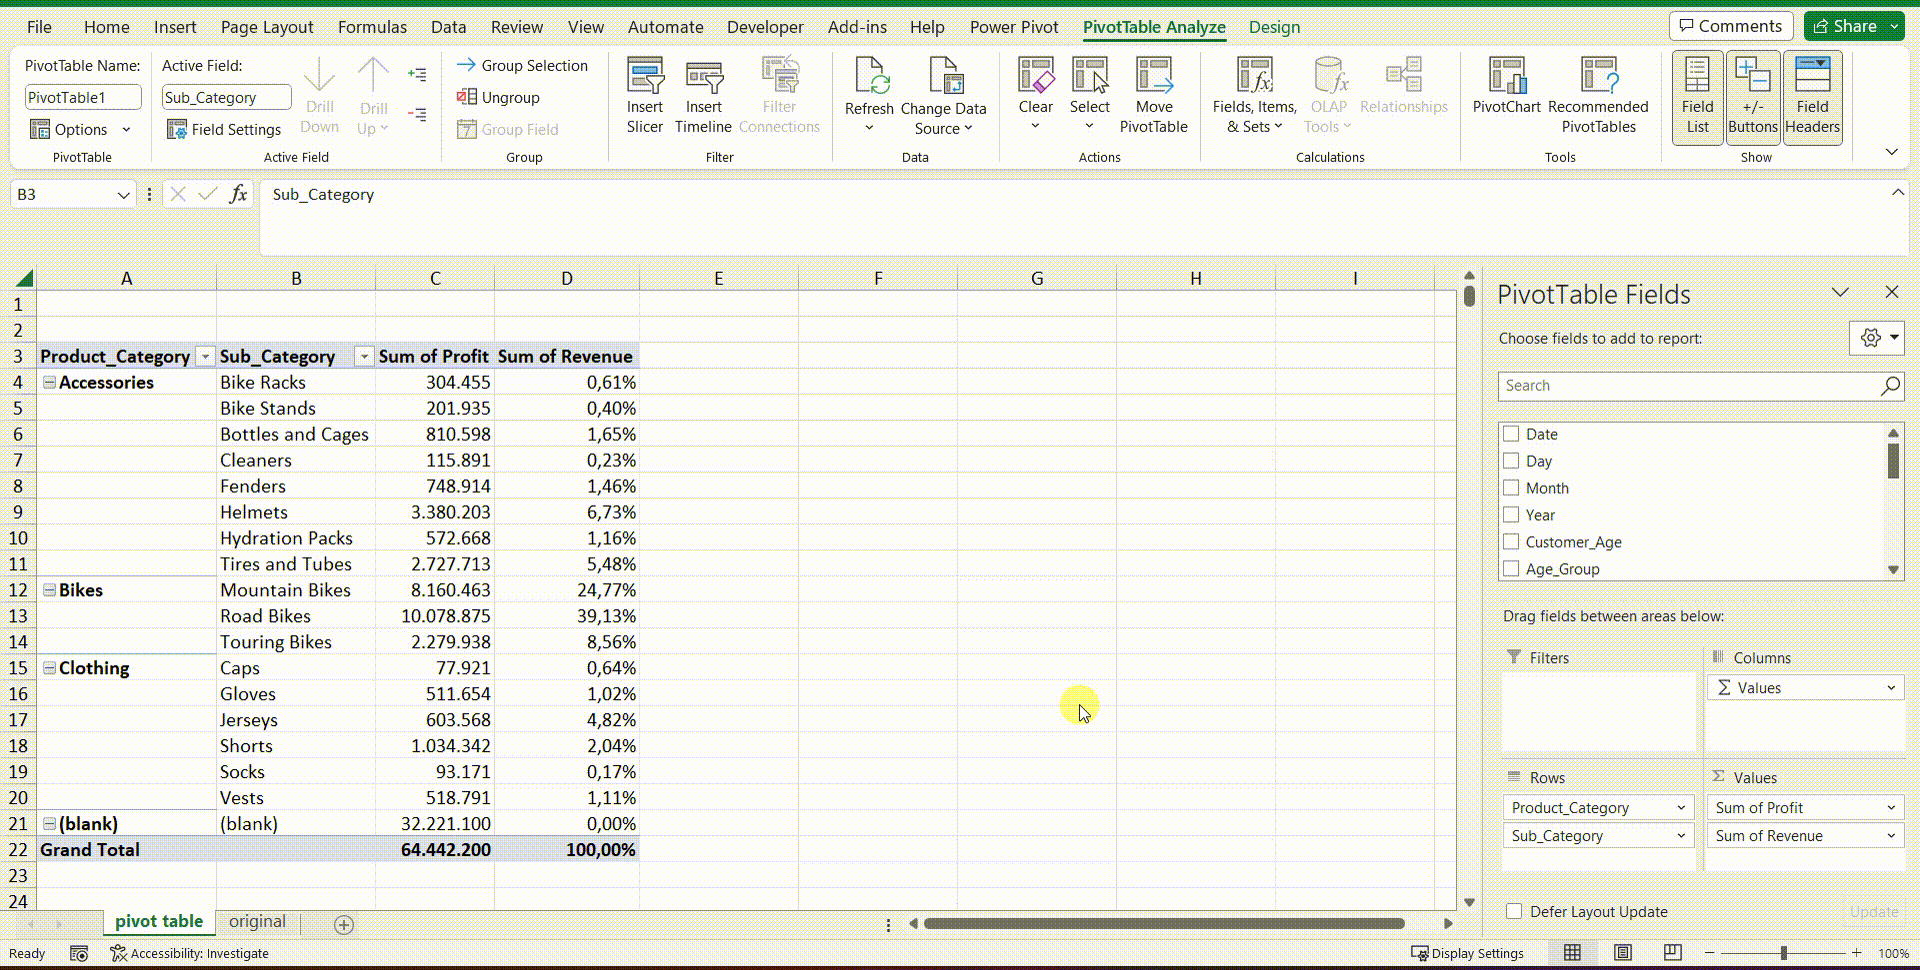
VALUES
You can show values in a couple of ways in Pivot tables. Usually, the value is shown as SUM or COUNT automatically, but you can show AVG, MIN, MAX, etc. You can also show value as an index or percentage of grand/row/column total, etc. There are options to do it using both right-click in the pivot table or in the Values window, and it’s super fast.

SLICER
One of my favorite features in Pivot is definitely the slicer you can add to your data set with a click. It helps filter the data significantly faster and is great for building dashboards. You can also add more than one slicer. If the data is somehow connected (for example, product categories and products), they will cancel each other out, meaning clicking on one will automatically filter the other:
If you want to learn how to show text in pivot tables, check one of my previous blogs.
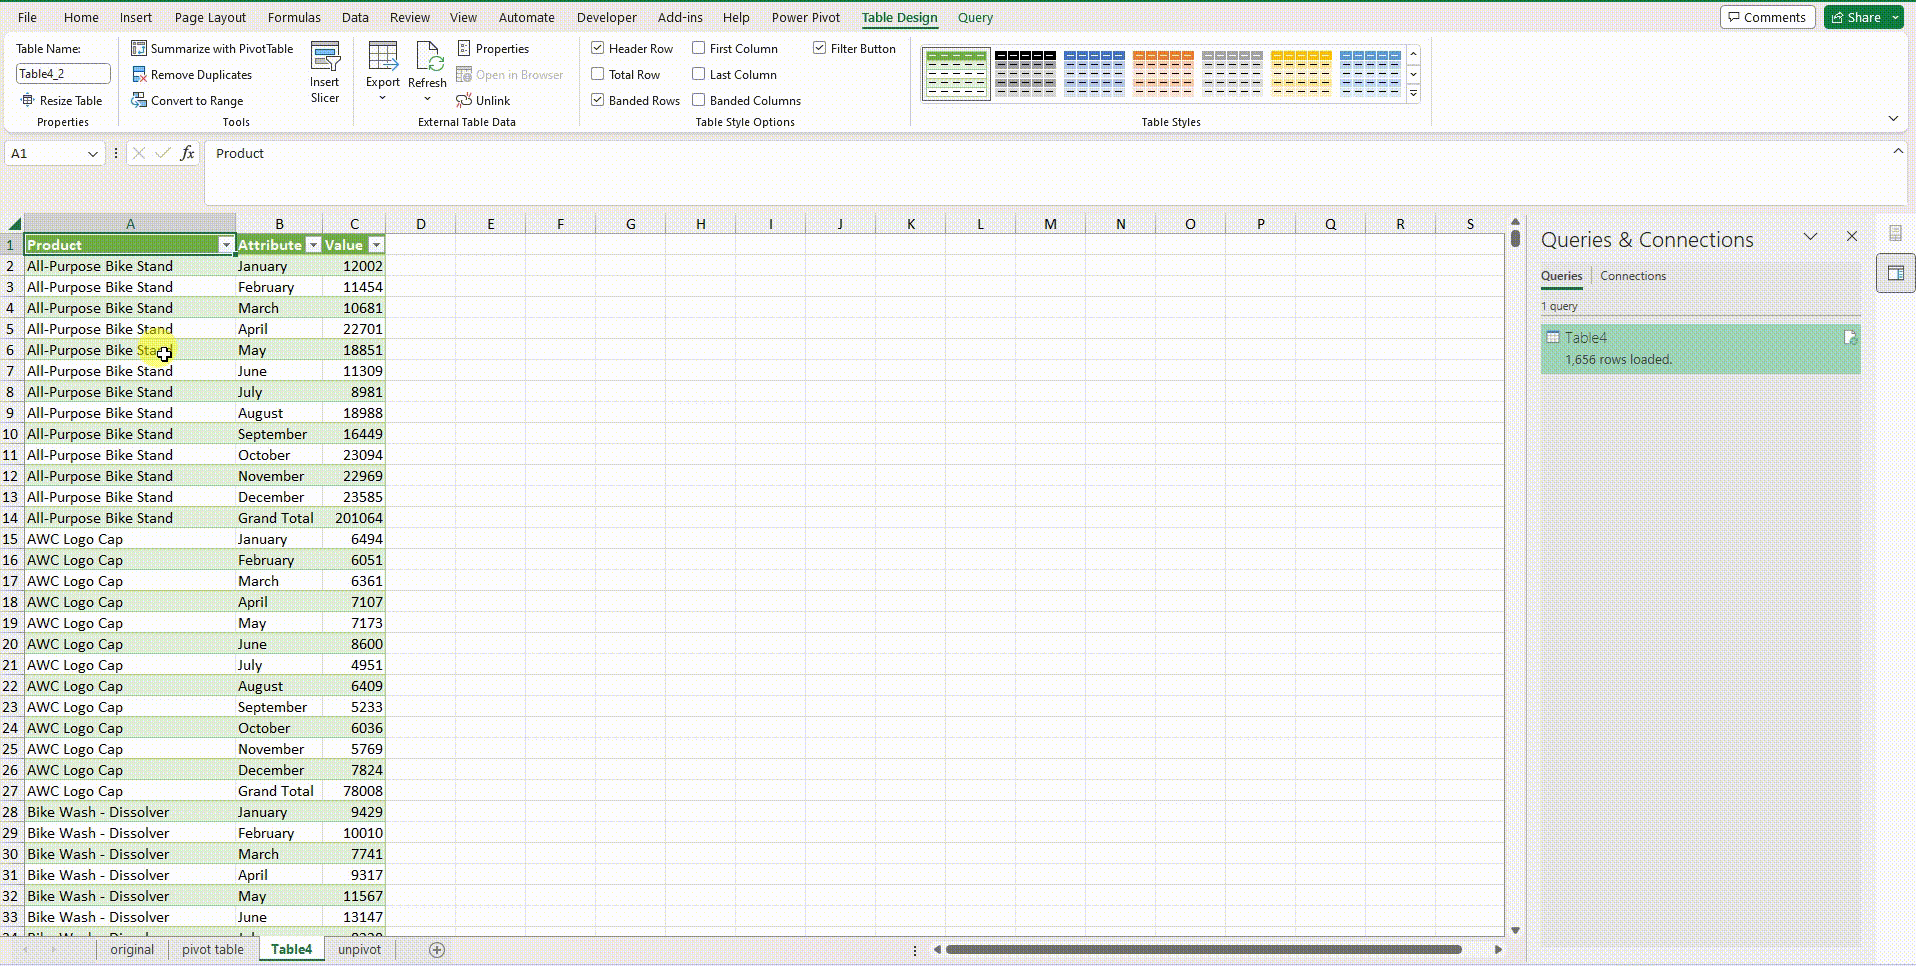
UNPIVOT
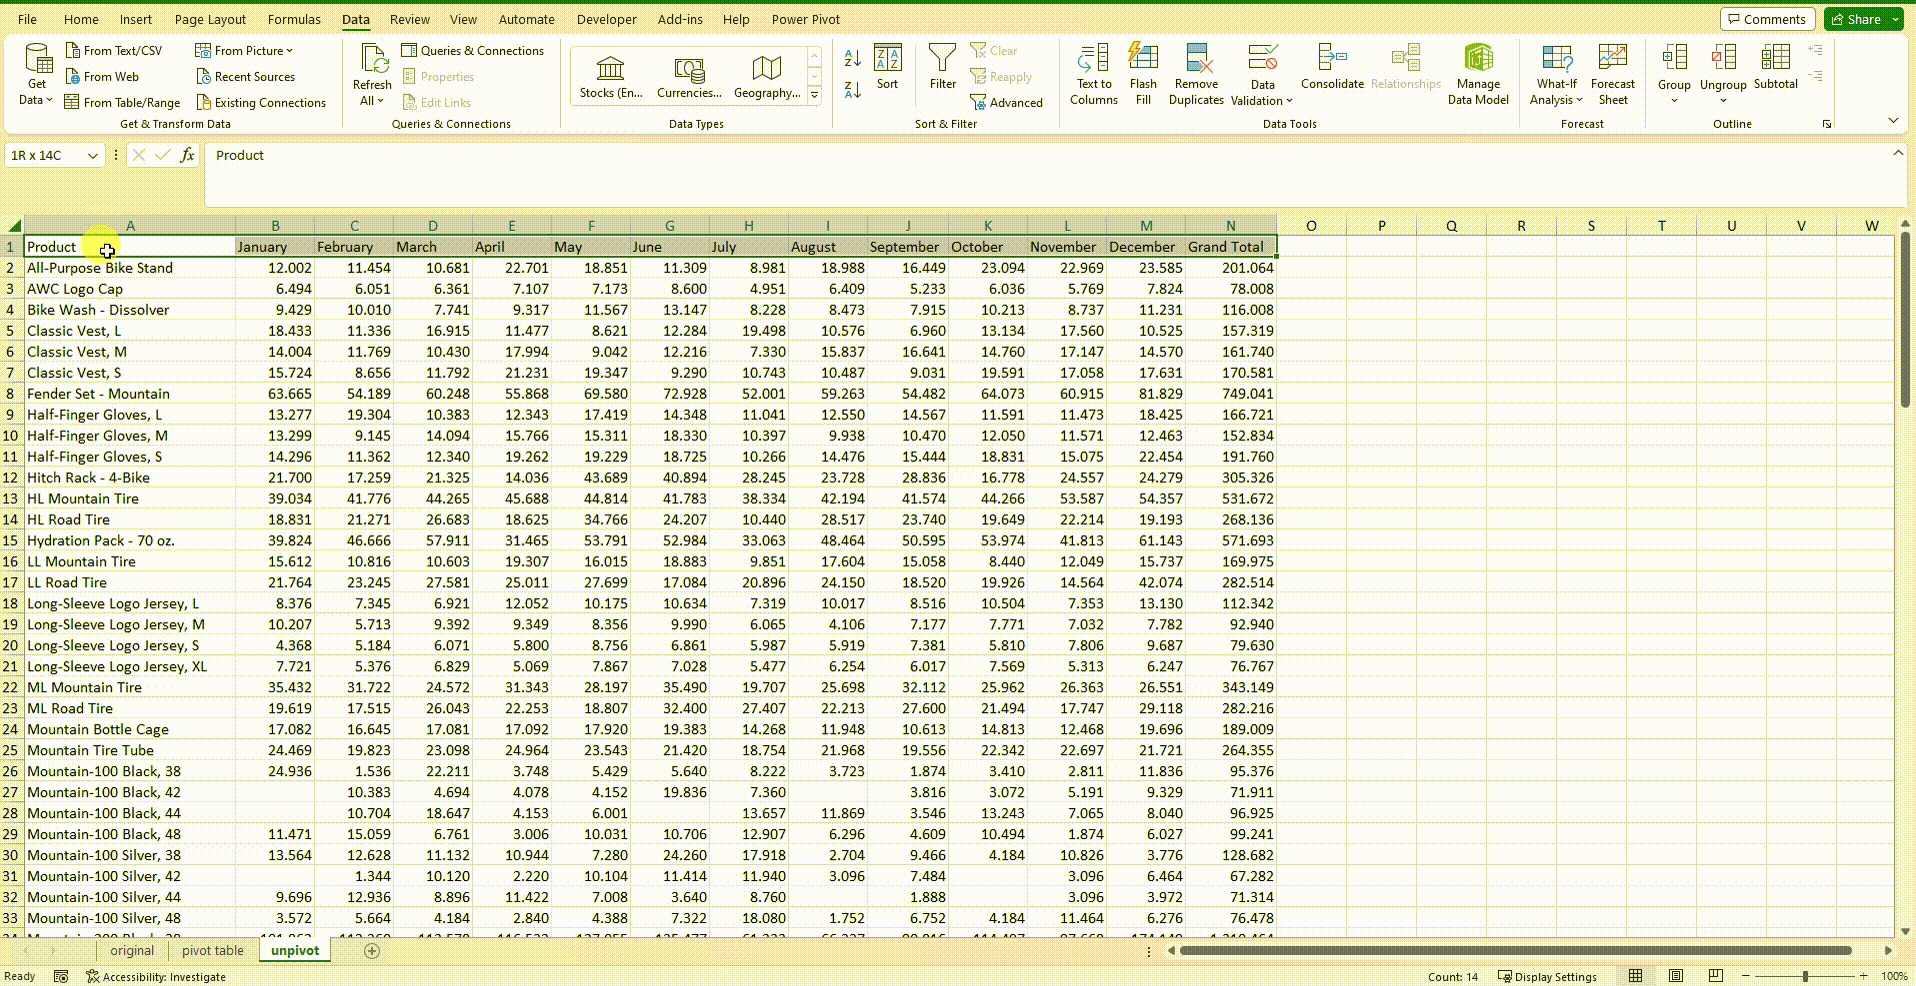
Unpivoting data is as cool as pivoting them, but you will need help from the Power Query feature. It’s actually pretty easy to do this. The first step is to turn your data into a table so you can load them in the query:
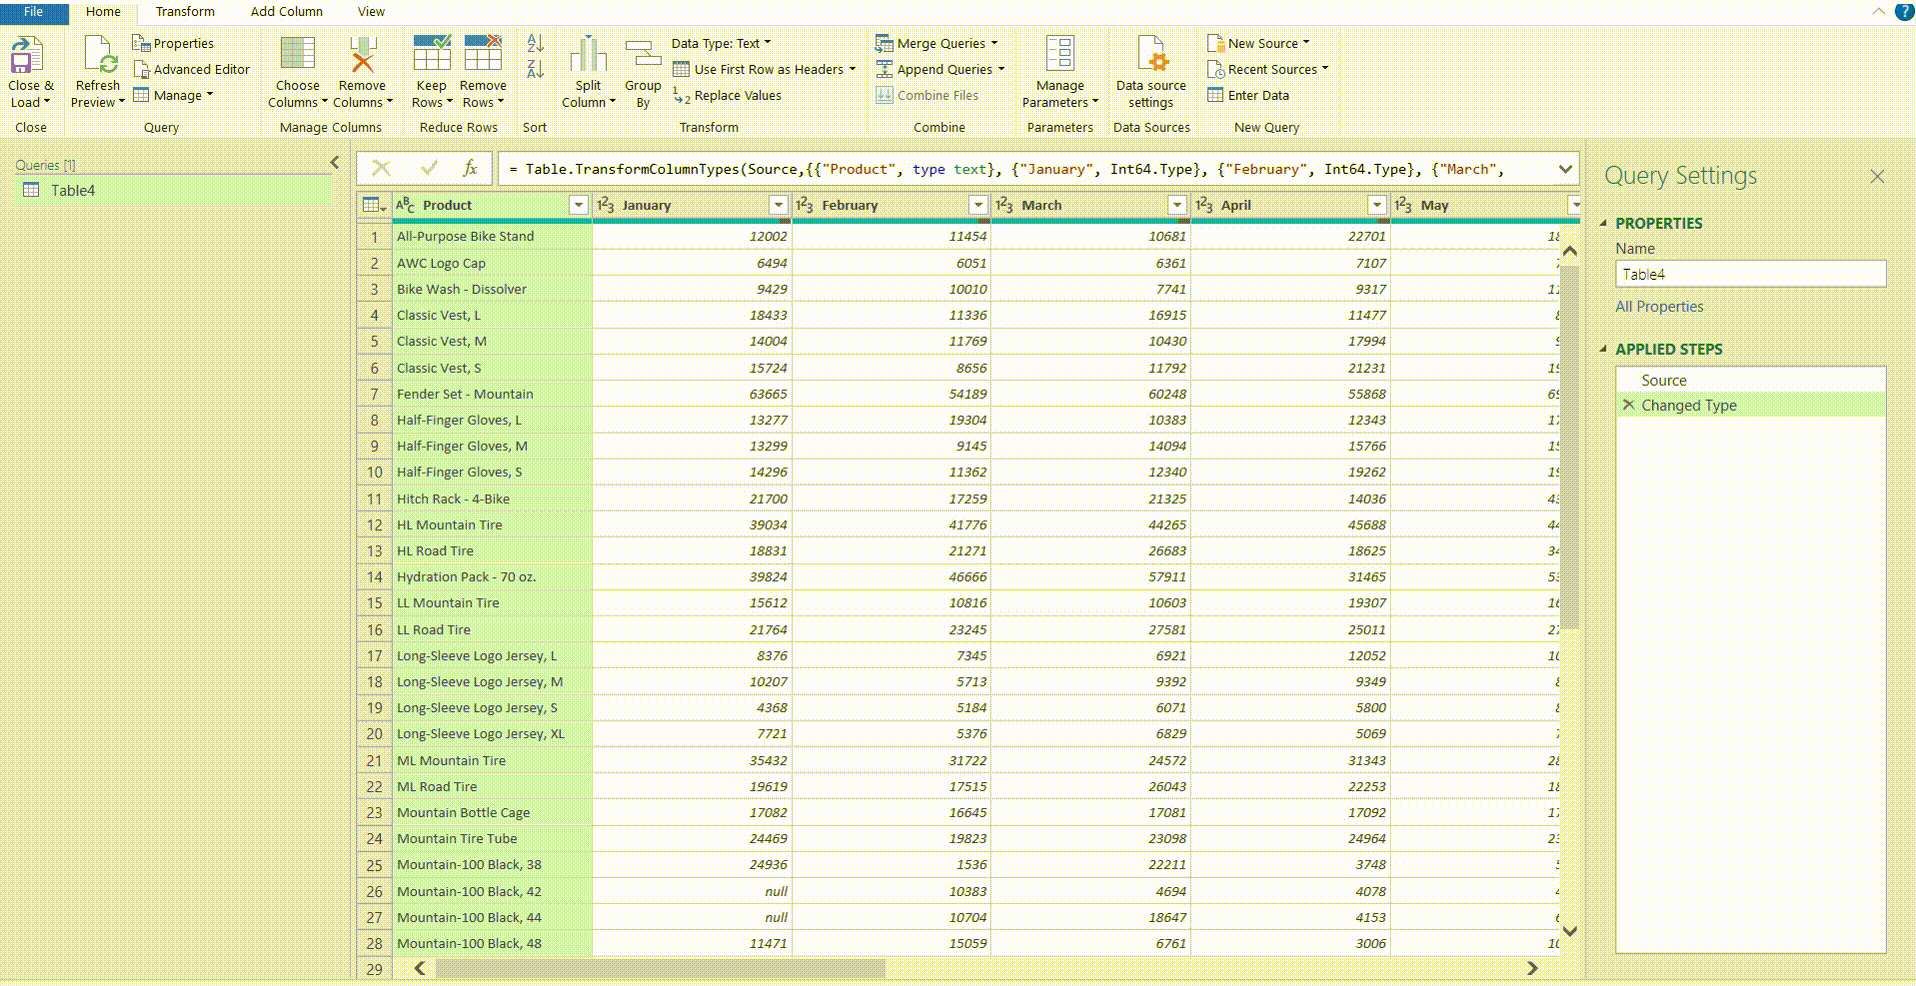
Power Query will open in the new window, and you then have to pick the columns you want to unpivot to one column. Choose the unpivot option in the Transpose window, and load the results back to the sheet:
And your data will be fastly unpivoted in the new sheet:
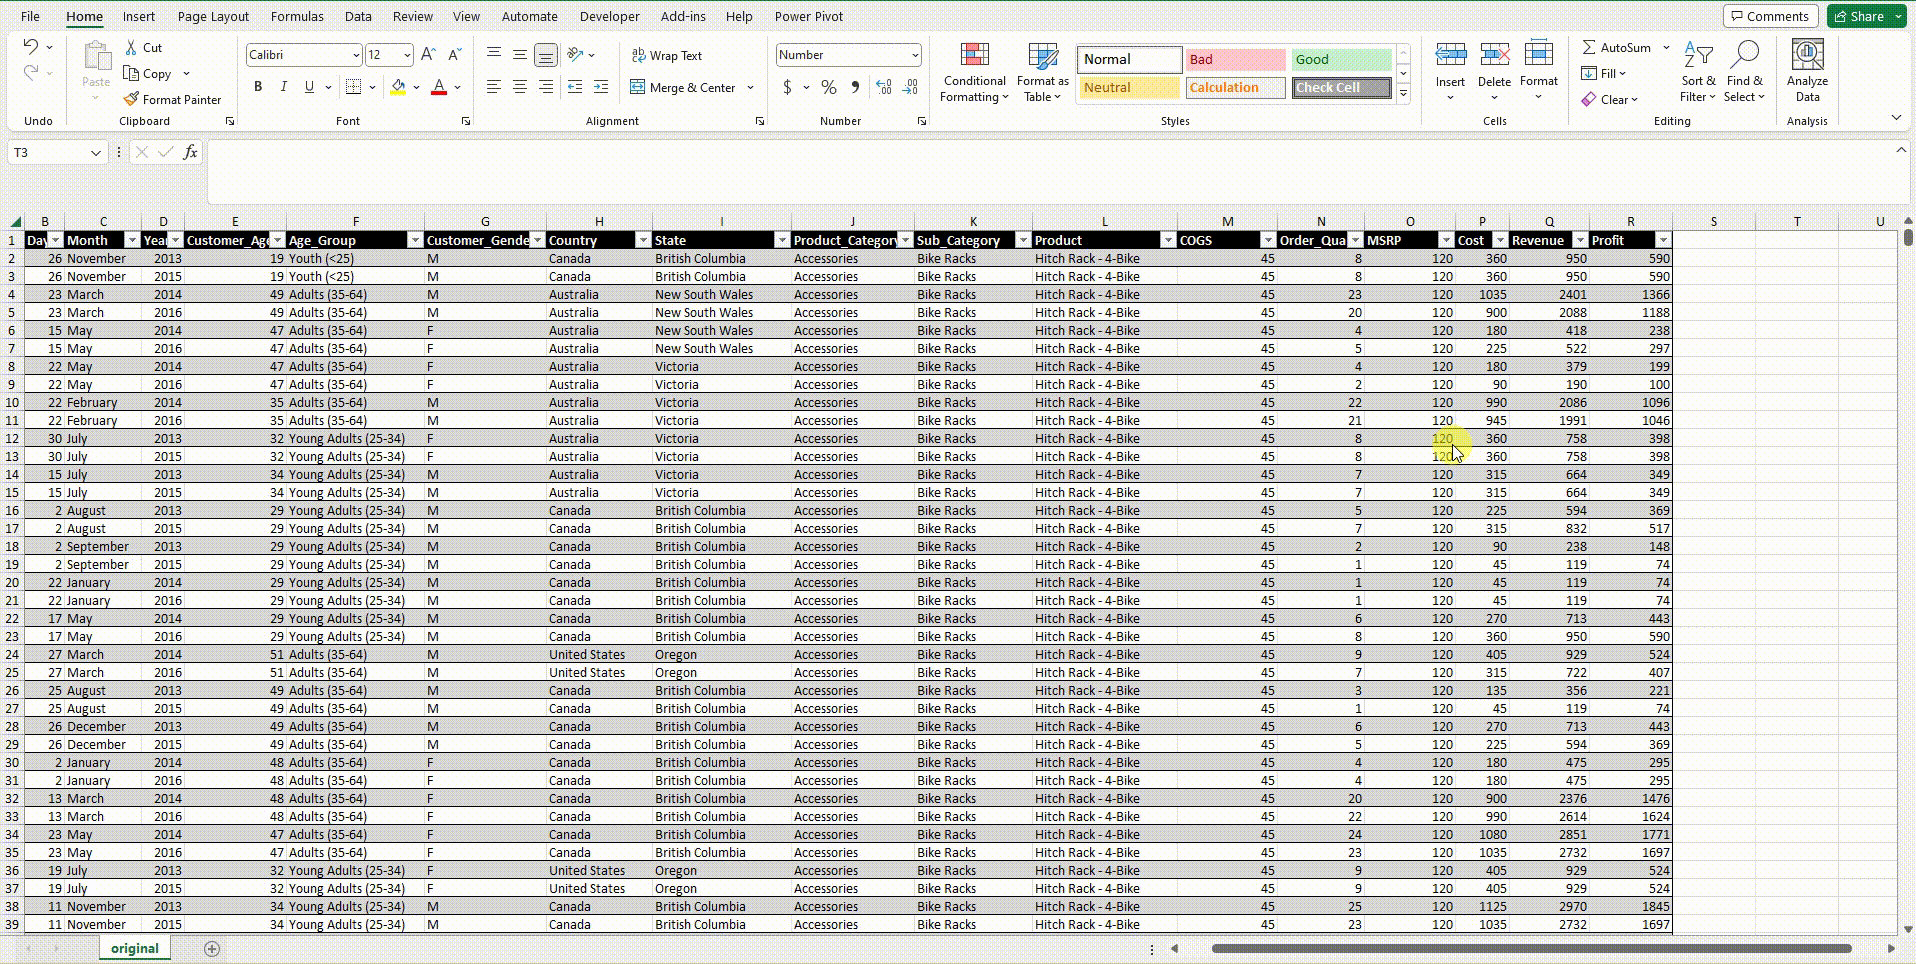
Tables
Let’s start with making a table. You can do it by clicking on Insert option > Table or using a shortcut CTRL + T. If you want to know more about shortcuts, check out this blog. You can also choose a predefined design for your table, which is pretty cool. When working with tables, the Table Design window automatically pops up, and this is where you will find all the features.

You can also remove or add new data in your table at any point using Resize Table feature.
AUTOMATED FORMULA CALCULATION
One of the most common mistakes in Excel models is inconsistent formulas. When you use tables, that can't happen because formulas automatically spread across the whole column. Tables also expand automatically to include new data, which is pretty handy.

DYNAMIC RANGES
One of the best features of tables is Dynamic ranges.
They are created automatically since the tables expand on their own as new data is added, and you can easily use them in your formulas. In the example below, our table is called “Table” (super original, I know), and we are trying to check the maximum profit:
DRAG 'N' DROP
Tables make it super simple to rearrange data with drag and drop. That basically means no more “There’s already data here. Do you want to replace it?” messages, and it can save you a lot of time while structuring your data.

TOTAL ROW
Total row is another cool feature in Excel tables which is helping you to avoid mistakes and work faster. Also, when you are working with a large table that does not fit on a screen, the header row always remains visible when you scroll down without freezing panes:

Some of the other cool features in Table Style Options are bolding the first or last column and removing banded rows (or adding banded columns). They can all be found in the Table Design window.
SLICER TABLE
You can also add slicers in tables which works the same as in pivot. You can add more of them, and data will be filtered automatically. They are super handy and easy to use.

So to sum it up, you can do some powerful data processing in Excel using Tables and Pivots. They work fast with huge data sets, it’s simple to use them, and you can get results pretty fast.
If you want to check some other helpful Excel tips, have a look at the posts below.
If you think that your financial models are overgrowing spreadsheets, and you need a better financial modeling tool, Farseer might be for you:
- Financial modeling in Farseer is centralized, fast, and consistent.
- You won’t need to worry about errors and mistakes.
- Natural language formulas are intuitive, error-proof, and cannot be deleted by accident.
- Sharing and exporting your work is granulated - you can share only parts of your model relevant to your user
- Built-in hierarchy makes modeling transparent by default
- Reorganize models by simply dragging and dropping entire spreadsheets to a specific location in the model.

LEARN MORE ABOUT FARSEER HERE